
Discover how data-driven UX improves user experiences through analytics, A/B testing, heatmaps, behavioral insights, personalization, and continuous optimization. Learn proven strategies to reduce friction, boost retention, refine micro-interactions, and build scalable design systems that drive engagement, usability, and measurable business growth.
In today’s digital landscape, providing seamless and intuitive interactions is a top priority for businesses and organizations of all sizes. This year (2026), teams are turning to data-driven UX strategies to move beyond guesswork and craft interfaces that resonate with actual user behavior. By harnessing quantitative metrics alongside qualitative feedback, designers can validate assumptions, uncover hidden pain points, and create experiences tailored to real user needs. In this article, we’ll guide you through the principles of data-driven UX—showing how analytics inform smarter design decisions, which tools empower those insights, and best practices for interpreting results responsibly. Whether you’re launching a new product or iterating on an existing platform, this comprehensive resource will help you build a clear roadmap for leveraging data effectively in your user experience process.
Why Embracing Data Driven UX Is Essential
Relying solely on intuition or comparative benchmarks can leave critical opportunities undiscovered. A data-driven UX approach anchors design choices in measurable evidence, ensuring that every change moves the needle in the right direction. For instance, research from the Nielsen Norman Group has shown that metrics-based optimization often yields significantly higher engagement and conversion rates compared to purely subjective design reviews.
When you adopt data-driven UX today, you gain several competitive advantages:
- Validated Insights: Hypotheses about user behavior are confirmed or refuted by real interaction data, reducing costly missteps.
- Friction Identification: Heatmaps and session recordings reveal precise drop-off points, helping you reengineer workflows for smoother completion.
- Conversion Boosting: Iterative A/B testing refines calls-to-action, forms, and onboarding flows, leading to higher goal completion.
- Personalization Opportunities: Segment-level analytics allow you to tailor messaging and layouts to different user cohorts, improving satisfaction and loyalty.
- ROI Measurement: By tracking key performance indicators, stakeholders can directly see the value of UX investments, making it easier to secure ongoing support.
Ultimately, integrating data at every stage—from discovery and prototyping to launch and iteration—creates a continuous feedback loop that drives user-centric innovation.
Building Your Foundation: Key Data Sources for UX Design
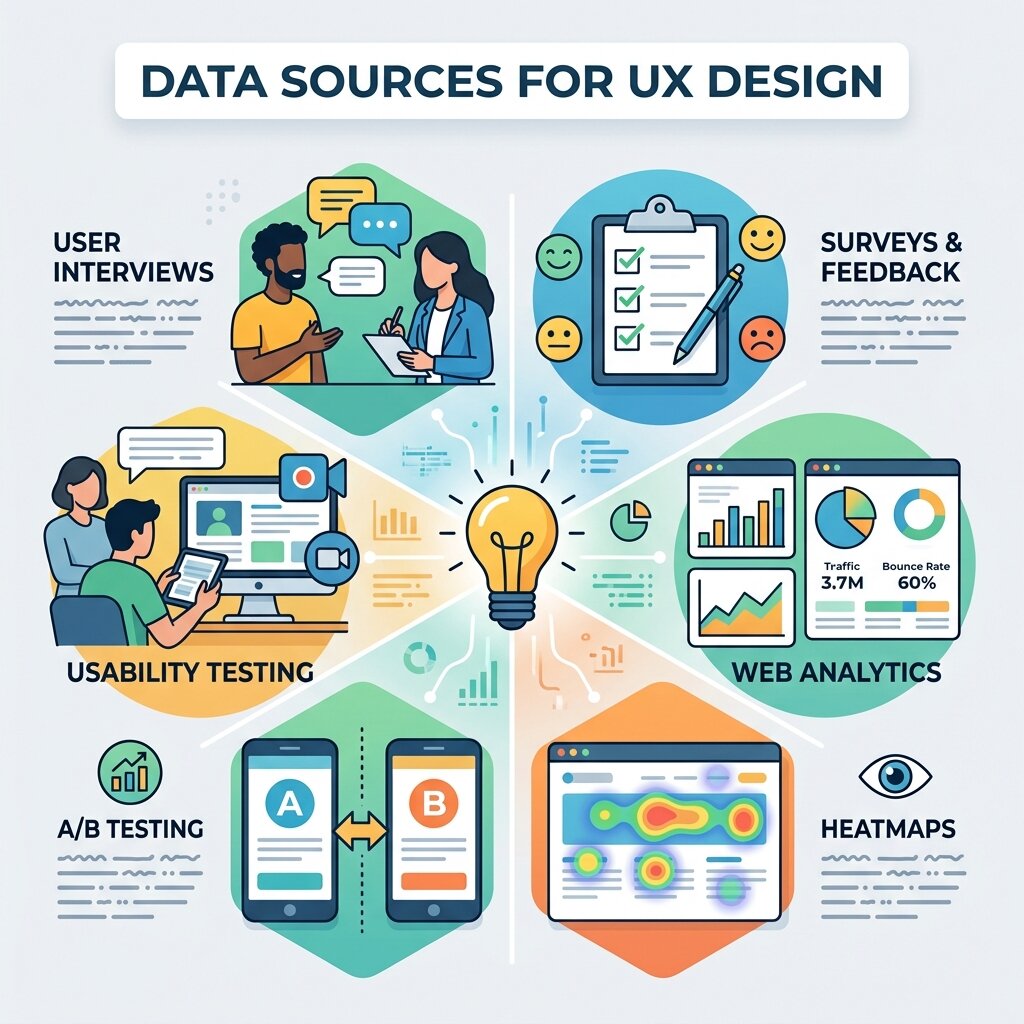 To create a full picture of user interactions, draw from multiple channels and combine them into a unified dashboard. Below are the core data sources that underpin a robust data-driven UX framework:
Web and App Analytics
Platforms such as Google Analytics 4 and Adobe Analytics deliver quantitative metrics on page views, session durations, bounce rates, and funnel visualization. These tools provide the high-level overview needed to pinpoint underperforming screens and optimize navigation flows.
Heatmaps and Clickmaps
Solutions like Hotjar and Crazy Egg generate visual overlays that show where users click, scroll, and hover. By spotting areas of confusion or overlooked content, design teams can rearrange page elements to capture attention and guide interactions more effectively.
Session Recordings
Watching anonymized recordings of actual user sessions offers a window into real-time behaviors—form validation errors, navigation loops, or unexpected gestures—that raw numbers alone can’t explain.
Surveys and Qualitative Feedback
In-app pop-ups, email questionnaires, or on-site intercepts yield contextual insights into user motivations and pain points. Combining these qualitative responses with quantitative measures ensures that you address both the “what” and the “why” behind user actions.
Cohort and Segment Analysis
Grouping individuals based on characteristics such as geography, device type, or experience level allows you to tailor UI adjustments for each cohort’s unique journey. This granularity is vital for crafting personalized experiences that resonate deeply.
Usability Testing Metrics
Lab or remote testing produces task completion rates, time-on-task, and standardized scores like the System Usability Scale (SUS). These combined data points offer a balanced mix of qualitative impressions and quantitative benchmarks.
Designing Smarter Experiments with A/B Testing
A/B testing sits at the heart of any data-driven UX initiative. By comparing two variations of a design, you can objectively determine which approach best meets your goals. Follow these structured steps for rigorous experimentation:
1. Formulate a Hypothesis
Begin with a clear statement—such as “Modifying the primary button color to navy blue will improve click-through rates by 8%.” This focused hypothesis sets the direction and scope of your test.
2. Identify Success Metrics
Select a primary KPI (e.g., conversion rate, average order value) and secondary indicators (e.g., session length, time to completion) to capture both direct and indirect impacts of your change.
3. Create Controlled Variants
Design the original (control) and the new version (variant) with one isolated change. Isolating variables ensures that any performance difference is attributable to that one element.
4. Calculate Sample Size
Use statistical calculators or built-in features in platforms such as Optimizely to determine the number of impressions or conversions needed for statistical confidence.
5. Deploy Concurrently
Launch both variants simultaneously to the same audience pool using tools like VWO or Google Optimize. Running them in parallel eliminates timing biases from external factors.
6. Analyze and Iterate
Once the test reaches significance, review the results. If your variant wins, implement the change site-wide. If not, refine your hypothesis and test again. Continuous experimentation fosters incremental improvements and reduces the risks associated with large-scale redesigns.
Essential Tools and Platforms for UX Analytics
 Having the right toolkit accelerates your journey toward a data-driven UX culture. Below are some industry-leading platforms that empower in-depth analysis and experimentation:
- Google Analytics 4: A free, versatile solution for tracking user journeys across web and app properties, featuring customizable exploration reports and funnel analyses.
- Mixpanel: Delivers event-based tracking that follows individual user interactions over time, supported by advanced cohort comparisons.
- Hotjar: Pairs heatmaps and session recordings with in-tool surveys, giving you both visual and context-driven insights.
- Crazy Egg: Offers click overlays, scroll maps, and confetti reports to dissect engagement by traffic source or referral channel.
- Optimizely: A robust experimentation suite that supports A/B, multivariate tests, and feature flagging across web and mobile apps.
- FullStory: Provides session replay and event analytics, allowing you to filter for specific errors or user actions with precision.
Integrate these platforms with a centralized dashboard or data warehouse—using services like AWS or Google BigQuery—to maintain an overarching view of all metrics and user segments.
Best Practices for Interpreting UX Data
 Raw numbers without context can lead to misleading conclusions. Apply these best practices to ensure that your data-driven UX insights are accurate and actionable:
- Segment Before You Summarize: Break down metrics by user type (new vs. returning), location, or device to uncover distinct behavior patterns hidden in aggregated data.
- Blend Quantitative and Qualitative: Pair numeric trends with user feedback or usability test observations to understand not just what is happening, but why it’s happening.
- Consider External Influences: Marketing campaigns, seasonal shifts, or concurrent feature launches can skew results. Factor these variables into your analysis to isolate the true effect of your design changes.
- Prioritize High-Value Areas: Direct your efforts toward pages or interactions with the greatest traffic, drop-off rates, or revenue potential for maximum impact.
- Maintain Tracking Hygiene: Regularly audit your analytics setup—remove obsolete events, verify correct tagging, and ensure consistent naming conventions across tools.
- Uphold Privacy Standards: Follow GDPR, CCPA, and other regulations. Provide transparent opt-in/opt-out options, and anonymize personal data where possible, per guidelines from NIST.
Predicting User Needs Through Behavioral Patterns
One of the strongest advantages of a data-driven UX workflow is the ability to predict user intent before friction appears. By analyzing repeated click paths, abandonment trends, and micro-interactions, teams can identify what users are likely to do next and redesign flows proactively. Predictive behavior mapping helps improve navigation structures, reduce decision fatigue, and streamline goal completion. This approach is especially useful in onboarding journeys, ecommerce funnels, and SaaS dashboards, where small usability gaps can heavily affect retention. When teams continuously refine interfaces based on real interaction patterns, they move from reactive design fixes to proactive experience engineering. Over time, this creates smoother journeys, stronger engagement, and a UX framework built around evidence instead of assumptions.
Creating Personalized Journeys for Different User Segments
Not every visitor interacts with a product in the same way, which is why segmentation is critical in UX optimization. By dividing users based on device type, traffic source, behavior depth, or returning frequency, teams can tailor layouts and messaging to better match expectations. A first-time mobile visitor may need simplified navigation, while returning desktop users may prefer deeper feature access. Personalized UX paths improve usability by reducing irrelevant choices and surfacing context-aware content. With the help of Generative AI and Adaptive Design, interfaces can dynamically evolve around individual usage behaviors, making digital products feel more intuitive and responsive. This personalization strategy strengthens retention, increases conversions, and creates more meaningful interactions across different audience groups.
Using Interaction Flow Analysis to Reduce Friction
Understanding how users move from one interface point to another is essential for uncovering usability issues. Interaction flow analysis tracks step-by-step progression through forms, menus, and conversion funnels to reveal hesitation zones or repeated loops. These friction points often indicate unclear calls-to-action, misplaced UI elements, or confusing page hierarchies. By restructuring these pathways based on real data, UX teams can significantly improve task completion rates and reduce abandonment. This method is particularly effective in checkout flows, sign-up sequences, and support journeys. A clean interaction flow minimizes mental effort, allowing users to achieve goals quickly and confidently while improving the overall perception of the digital experience.
Enhancing Micro-Interactions for Better Engagement
Small interface moments often shape how users emotionally perceive a product. Hover states, loading feedback, button responses, and transition cues all contribute to clarity and trust. By analyzing engagement metrics around these micro-interactions, teams can determine whether users feel guided or confused. Subtle refinements—such as faster response animations, clearer state changes, or more intuitive swipe behavior—can improve satisfaction without requiring a full redesign. In modern interfaces, Motion Design in Digital environments plays an important role in making these moments feel smooth and intentional. When motion supports feedback instead of decoration, users experience stronger confidence, better orientation, and improved task flow across both web and mobile products.
Improving Retention Through Continuous UX Iteration
The most successful digital experiences are rarely created in a single release cycle. Instead, they evolve through continuous measurement, testing, and refinement. Retention-focused UX teams monitor recurring behaviors such as repeat visits, feature adoption, and return intervals to identify where long-term engagement weakens. These insights allow teams to introduce targeted interface improvements, remove low-value friction, and strengthen habit-forming pathways. Continuous UX iteration also reduces the risk of large-scale redesign failures because every improvement is validated incrementally. This long-term optimization mindset supports sustainable product growth and ensures that design decisions remain aligned with changing user expectations.
Building Scalable UX Systems with Data Governance
As organizations grow, maintaining consistency across UX data sources becomes increasingly important. Without structured governance, tracking systems become fragmented, naming conventions drift, and insights lose reliability. Establishing a scalable framework for event taxonomy, dashboard ownership, and reporting standards helps preserve decision accuracy across teams. Product managers, designers, and analysts benefit from shared definitions that ensure everyone interprets the same behavior consistently. Strong UX data governance also accelerates experimentation by making insights easier to trust and act upon. When data pipelines remain clean and scalable, organizations can expand design optimization efforts confidently across multiple products, platforms, and customer journeys.
FAQ
What is data-driven UX?
Data-driven UX refers to the practice of using quantitative analytics and qualitative feedback to inform design decisions. Instead of relying on assumptions, teams validate hypotheses with real user behavior data to optimize interfaces effectively.
How do I get started with a data-driven UX approach?
Begin by integrating a single data source—such as heatmaps or A/B testing—into your workflow. Establish clear success metrics, collect initial data, and iterate based on findings. Over time, expand to multiple analytics platforms and qualitative methods for a holistic view.
Which tools are essential for UX analytics?
Core tools include web analytics platforms (Google Analytics 4), heatmapping services (Hotjar), session replay solutions (FullStory), and experimentation suites (Optimizely). Selecting the right combination depends on your budget, technical setup, and business objectives.
How can I ensure privacy compliance when collecting UX data?
Adhere to regulations like GDPR and CCPA by obtaining user consent for tracking, anonymizing personal information, and maintaining transparent data handling practices. Regular compliance audits and clear opt-in/opt-out mechanisms are key.
Conclusion
In today’s competitive environment, adopting a data-driven UX framework is crucial for delivering meaningful and efficient user experiences. By leveraging analytics, qualitative feedback, and structured experimentation, teams can eliminate guesswork, validate design decisions, and iterate with confidence. Start by integrating one data source—such as heatmaps or A/B testing—then expand your practice across the organization. Maintain rigorous data hygiene, respect user privacy, and always combine numbers with context to ensure balanced insights. With the right mindset, tools, and continuous feedback loops, you’ll foster smarter design cycles that delight users and drive tangible business results in 2026.


